| Client: | Memgraph Ltd |
| Deliverables: | Design system (v1.0), Demo applications (v1.0) |
| Time: | Dec 2017 - Feb 2018 |
| Team: | Product & Business dev, 2 full-stack engineers |
| My role: | UX/UI Designer, UI Engineer (Foundation SCSS, Jekyll) |
Introduction
Memgraph is the world’s first real-time distributed graph database, which aims to deliver high-performance at enterprise scale. It is engineered to support the needs of enterprises with colossal amounts of data. Memgraph aims to help businesses harness the power of real-time connected data, so they can build the next generation of intelligent applications.
Problem space
Memgraph’s Demo Applications need to showcase the live previews of different datasets in order to better represent the product’s capabilities to prospective clients. Use cases cover industries such as telecommunication, finance or IT network management. The demos are usually presented at meetings and on trade shows and need to be quickly developed and adjusted.
Research
We collected all the product feedback we had from meeting prospective or existing clients, looked into competitors and had co-creation workshops to define the best possible solutions for data visualization. We also took a deep look at competitors to see how they tackle the problem of complex graph data visualization.
Together with core team, I laid out a customer journey based on the feedback collected from surveying early adopters and target audience. We found out that we needed to focus our efforts on users from two sides - the business side (decision makers) and technical side (developers).
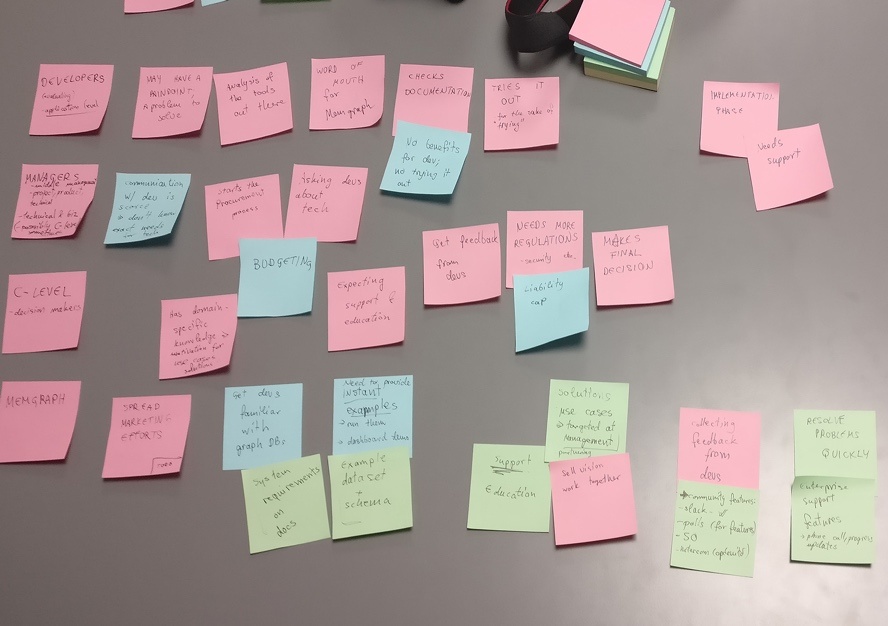
Journey mapping
Problems
- How to enable users to navigate through real-time graph data seamlessly?
- How can users (especially ones with decision power) better understand if Memgraph can handle their data?
- How can Memgraph promote brand awareness on trade shows and business meetings?
Goals
- Showcase Memgraph’s capabilities to prospective clients in real-time
- Enable Memgraph team to easily create and deploy new use-case demo applications when needed
Target audience
- System administrator
- Database administrator
- Data scientist
- C-Level Management (CTOs)
Ideation
We wanted to showcase 5 different use-cases of Memgraph, but keep a consistent look and feel between them. The first step in doing that was to identify requirements for demos and to lay out the modular layout that can accommodate all of these features.
Main Requirements for demo applications
- Card Fraud Detection
- settings for defining transaction parameters
- option to run a query, which yields the result represented in a graph
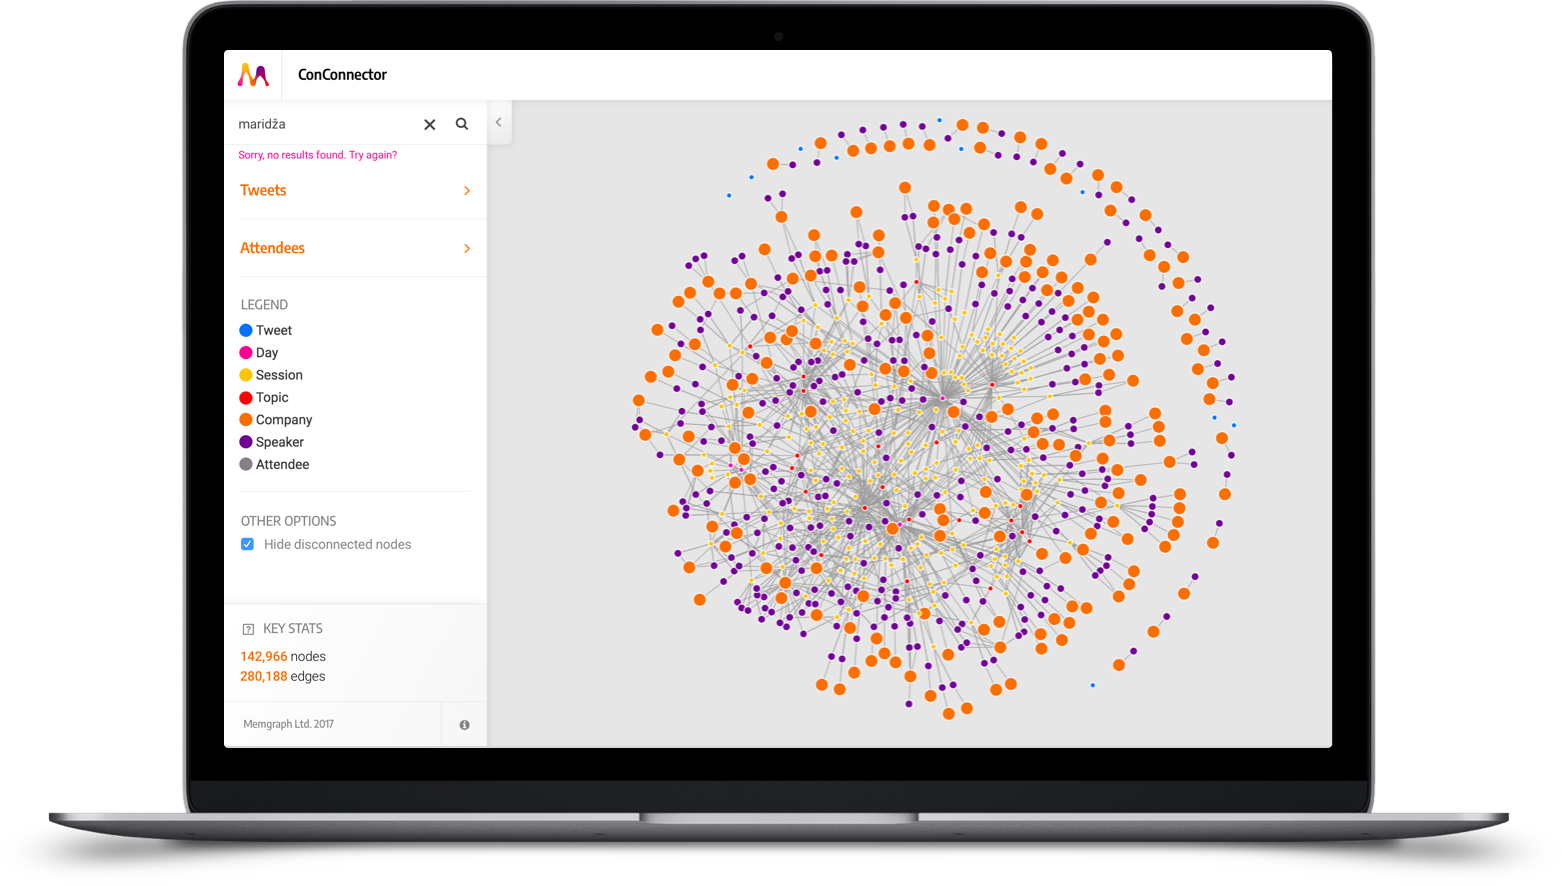
- StrataData Conference Connector
- show conference-related data in real-time in a graph and make it searchable
- allow real-time preview of new attendees and tweets related to the conference during the conference itself
- Data Lineage with GitHub Commits
- run example queries on a given dataset and show the result in a graph
- Blockchain Analysis ()Anti Money Laundering) - run example queries on a given dataset, show results in tabular and graph mode
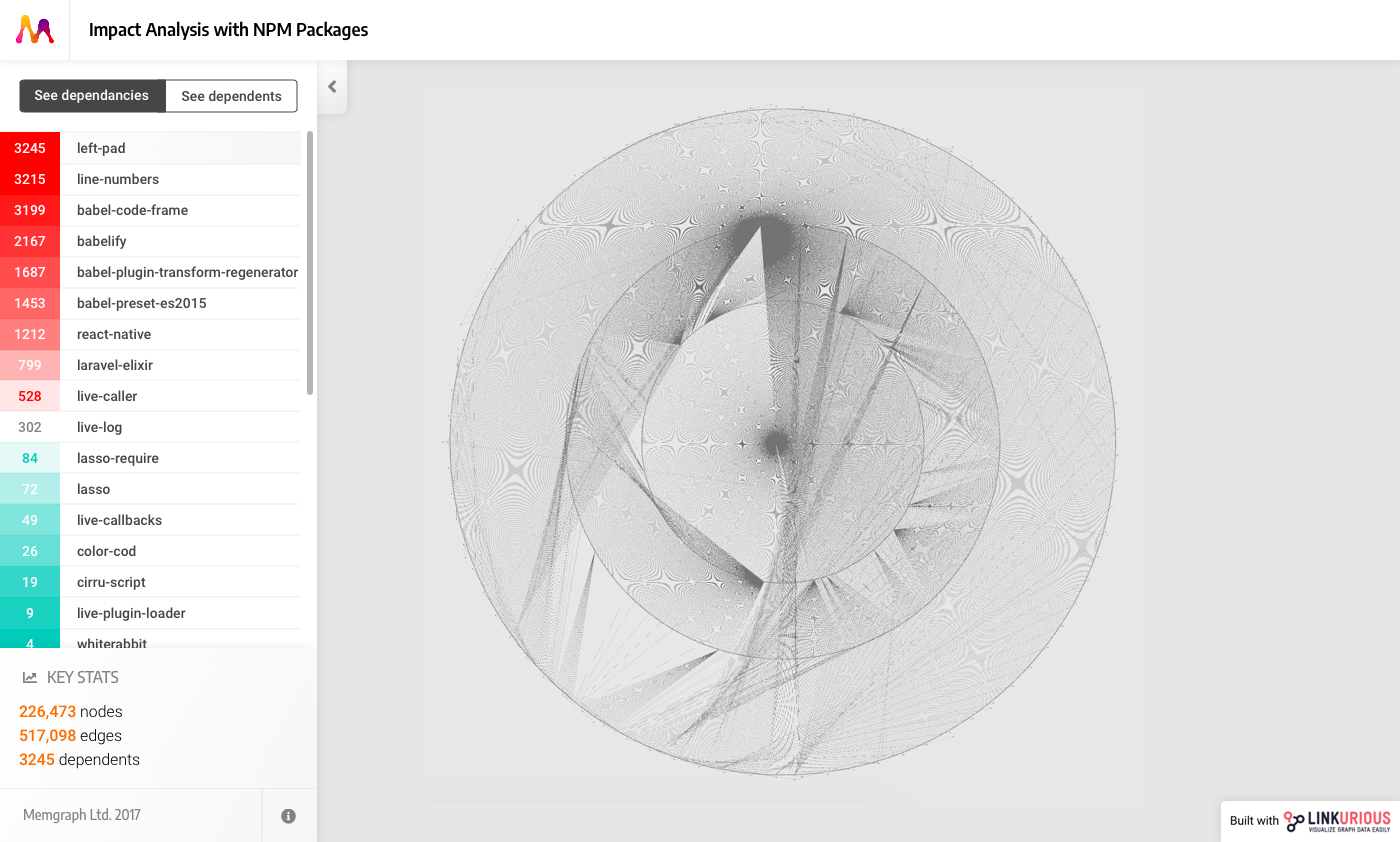
- Impact Analysis with NPM Packages - show color-coded risk analysis of dependencies for listed packages
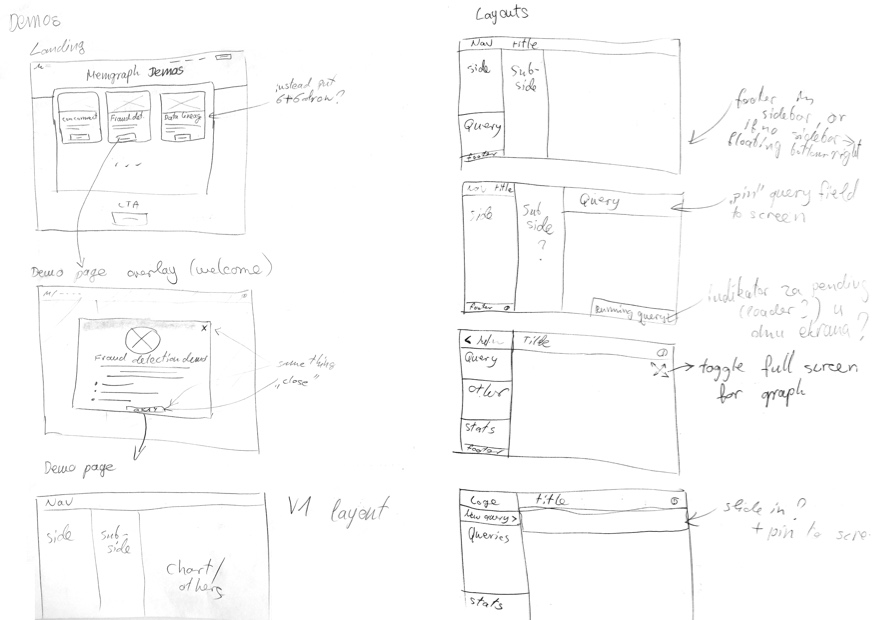
Demo low fidelity wireframes
I made detailed wireframes and flow diagrams for all five demo use-cases to serve as a reference point for testing and communication with stakeholders and developers before progressing towards development. Example below is for the ConConnector demo.
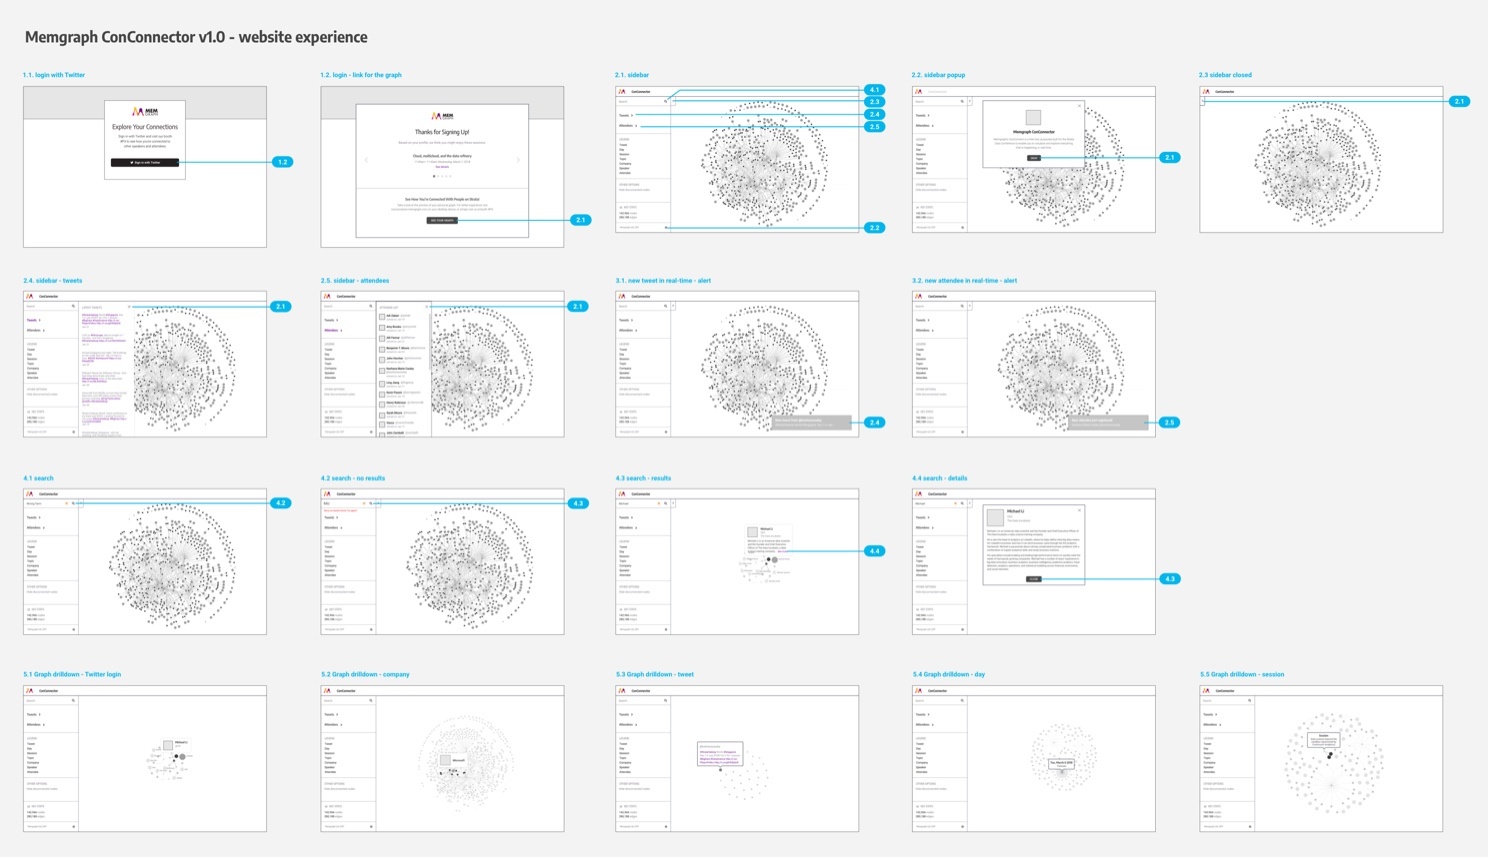 ConConnector wireframes
UI design
Consistent UI design was imperative for all applications, to ensure smooth experience when demonstrating product capabilities. To achieve this, I built a simple Sketch component library. Consistency also meant that modular design ensured that same components can be reused during development process.
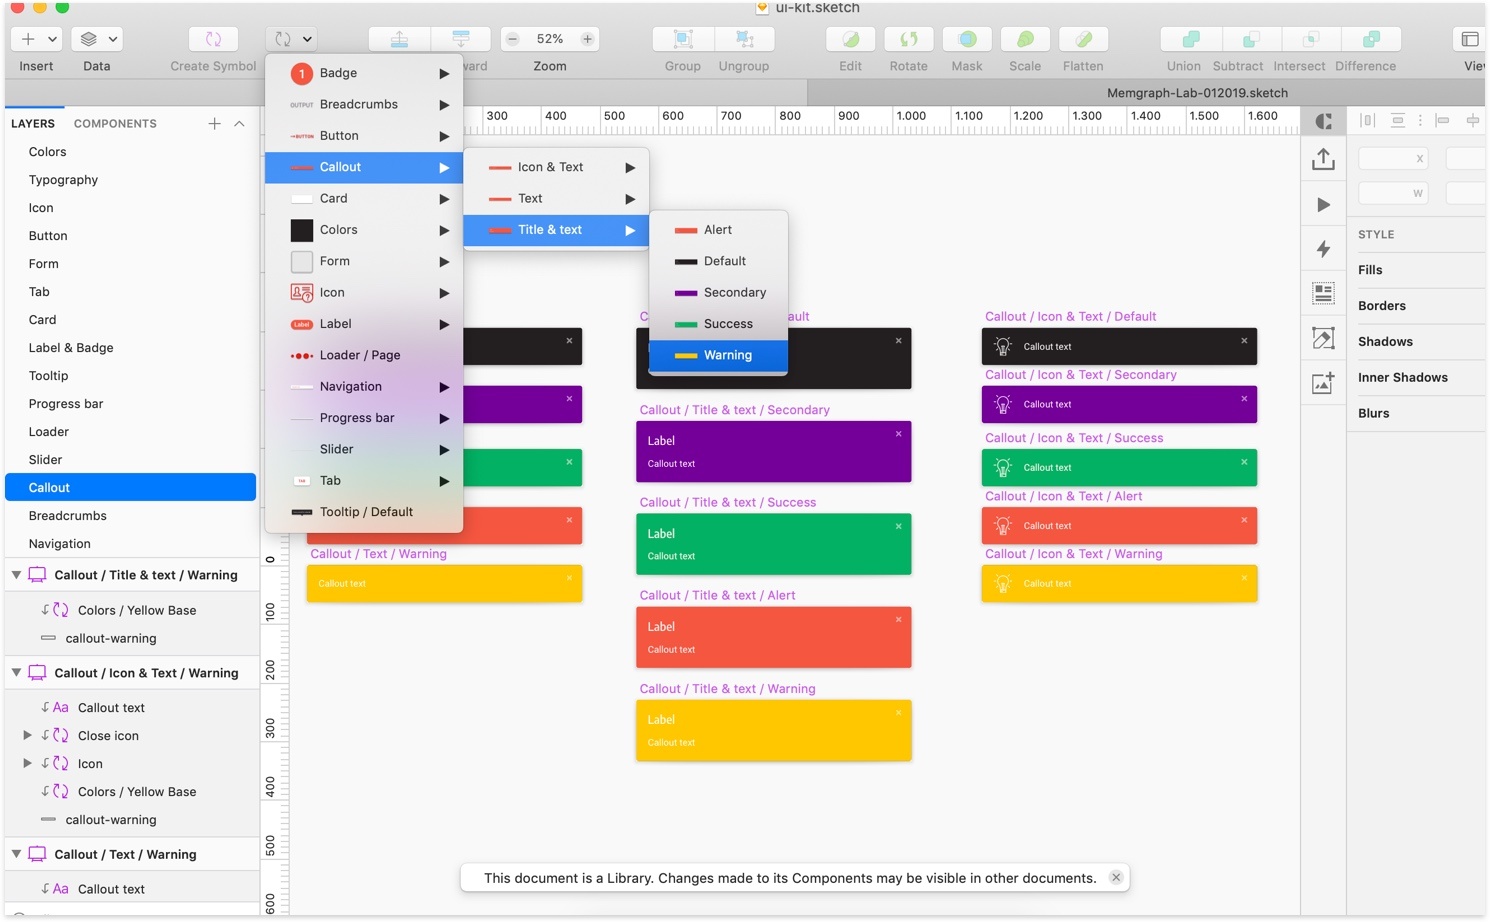 Component library in Sketch for Memgraph project
Images below show four screens coming from different demo applications, while using shared components.
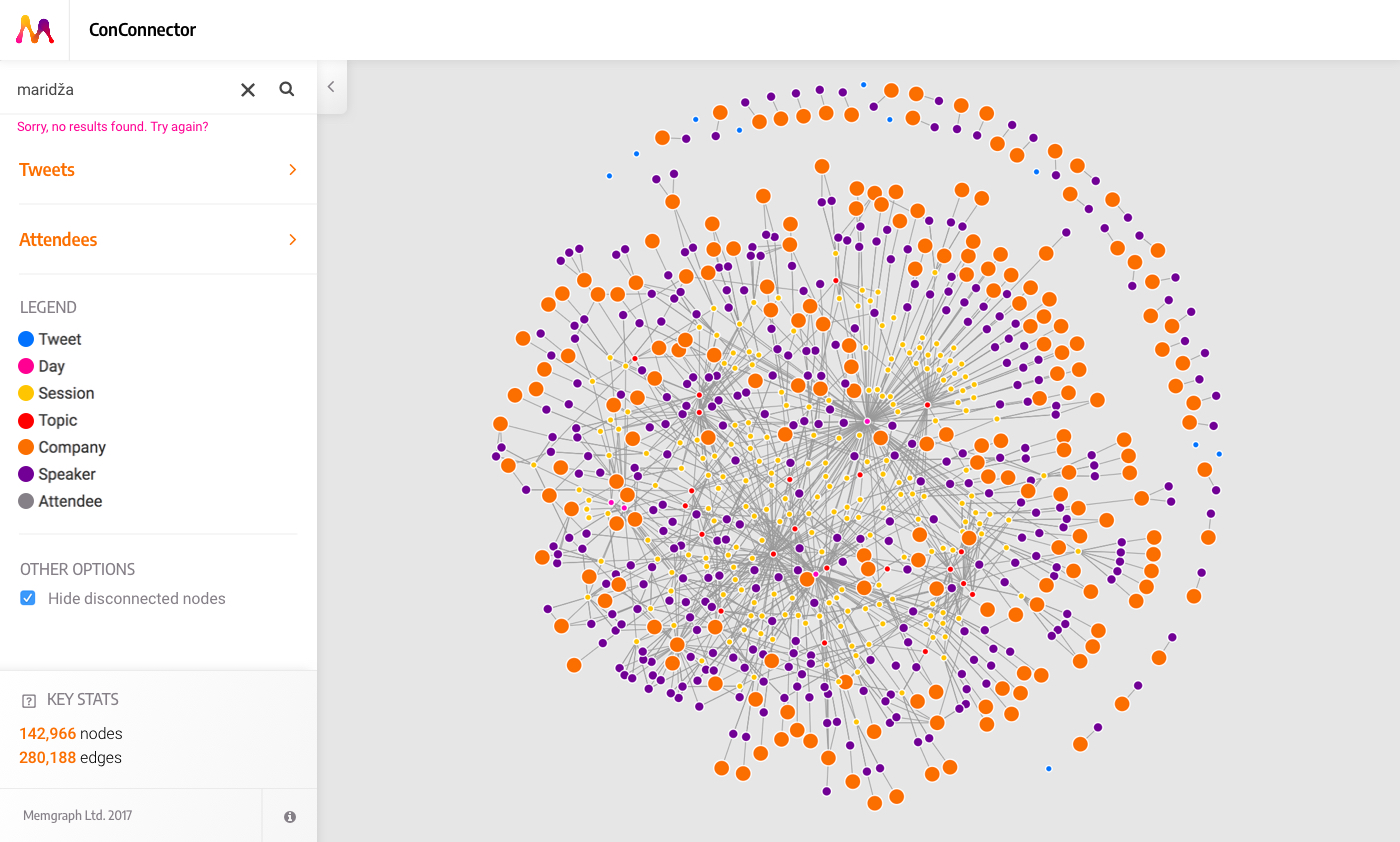
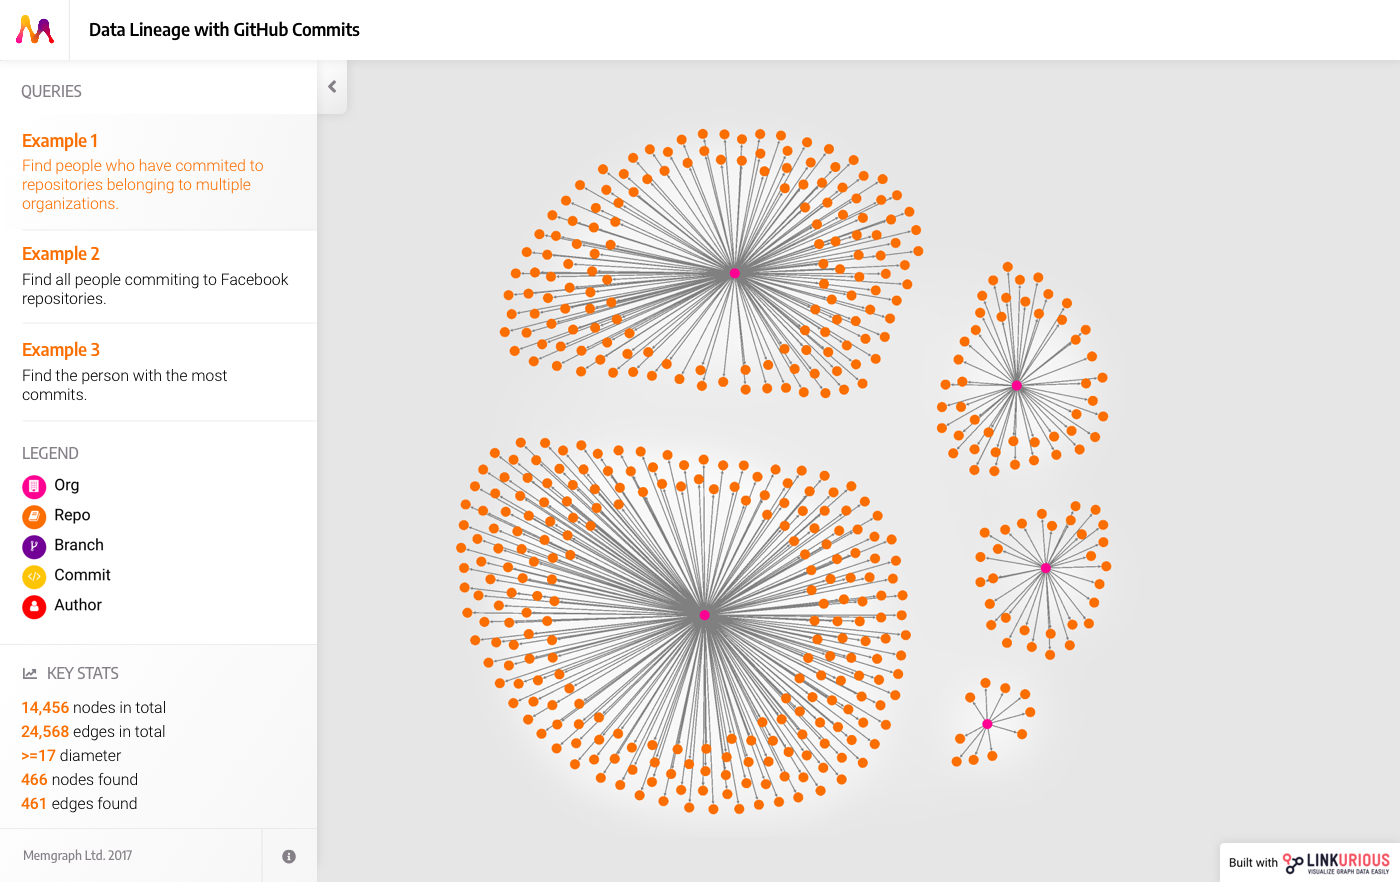
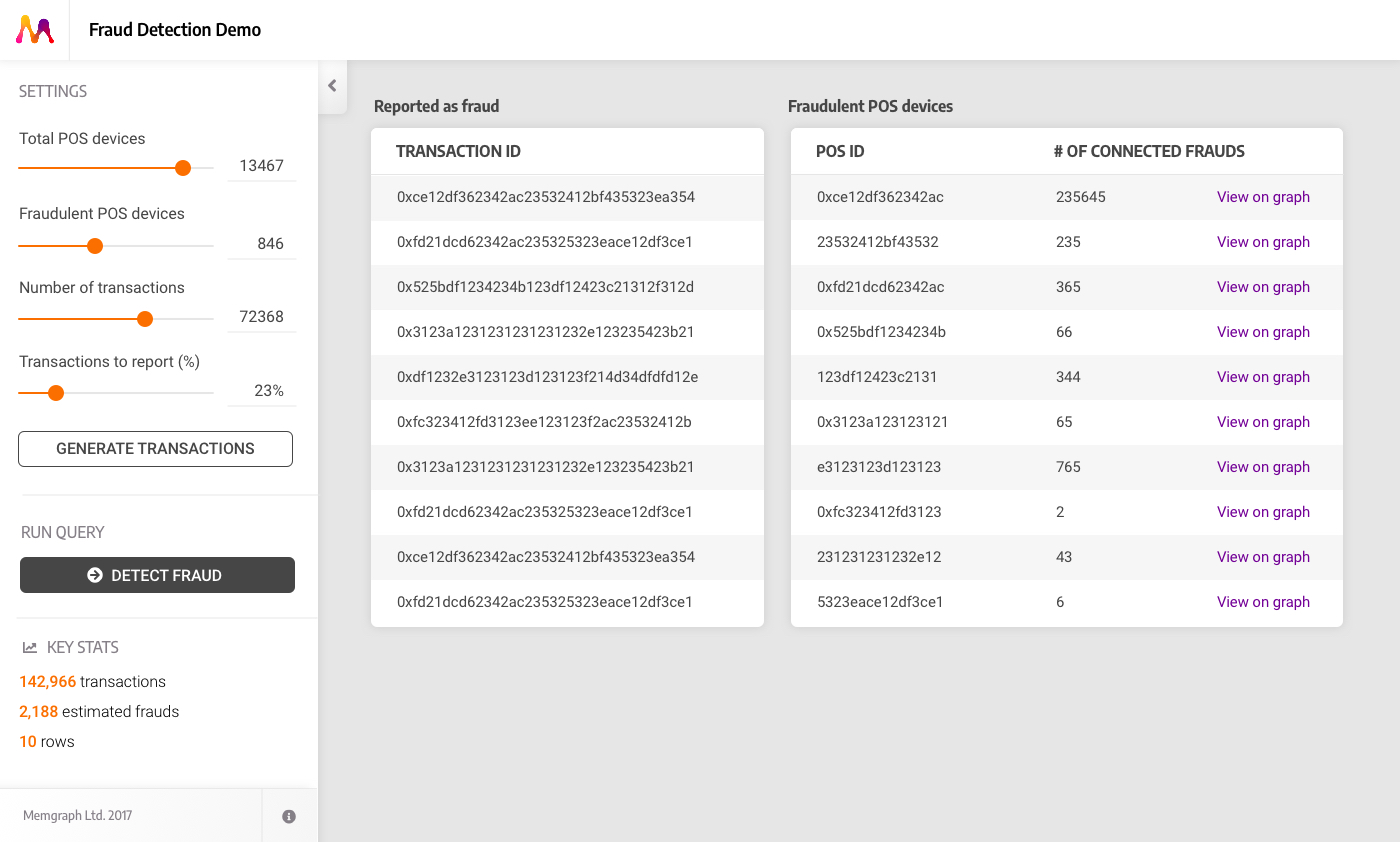
 Memgraph demo applications - UI
From design to implementation
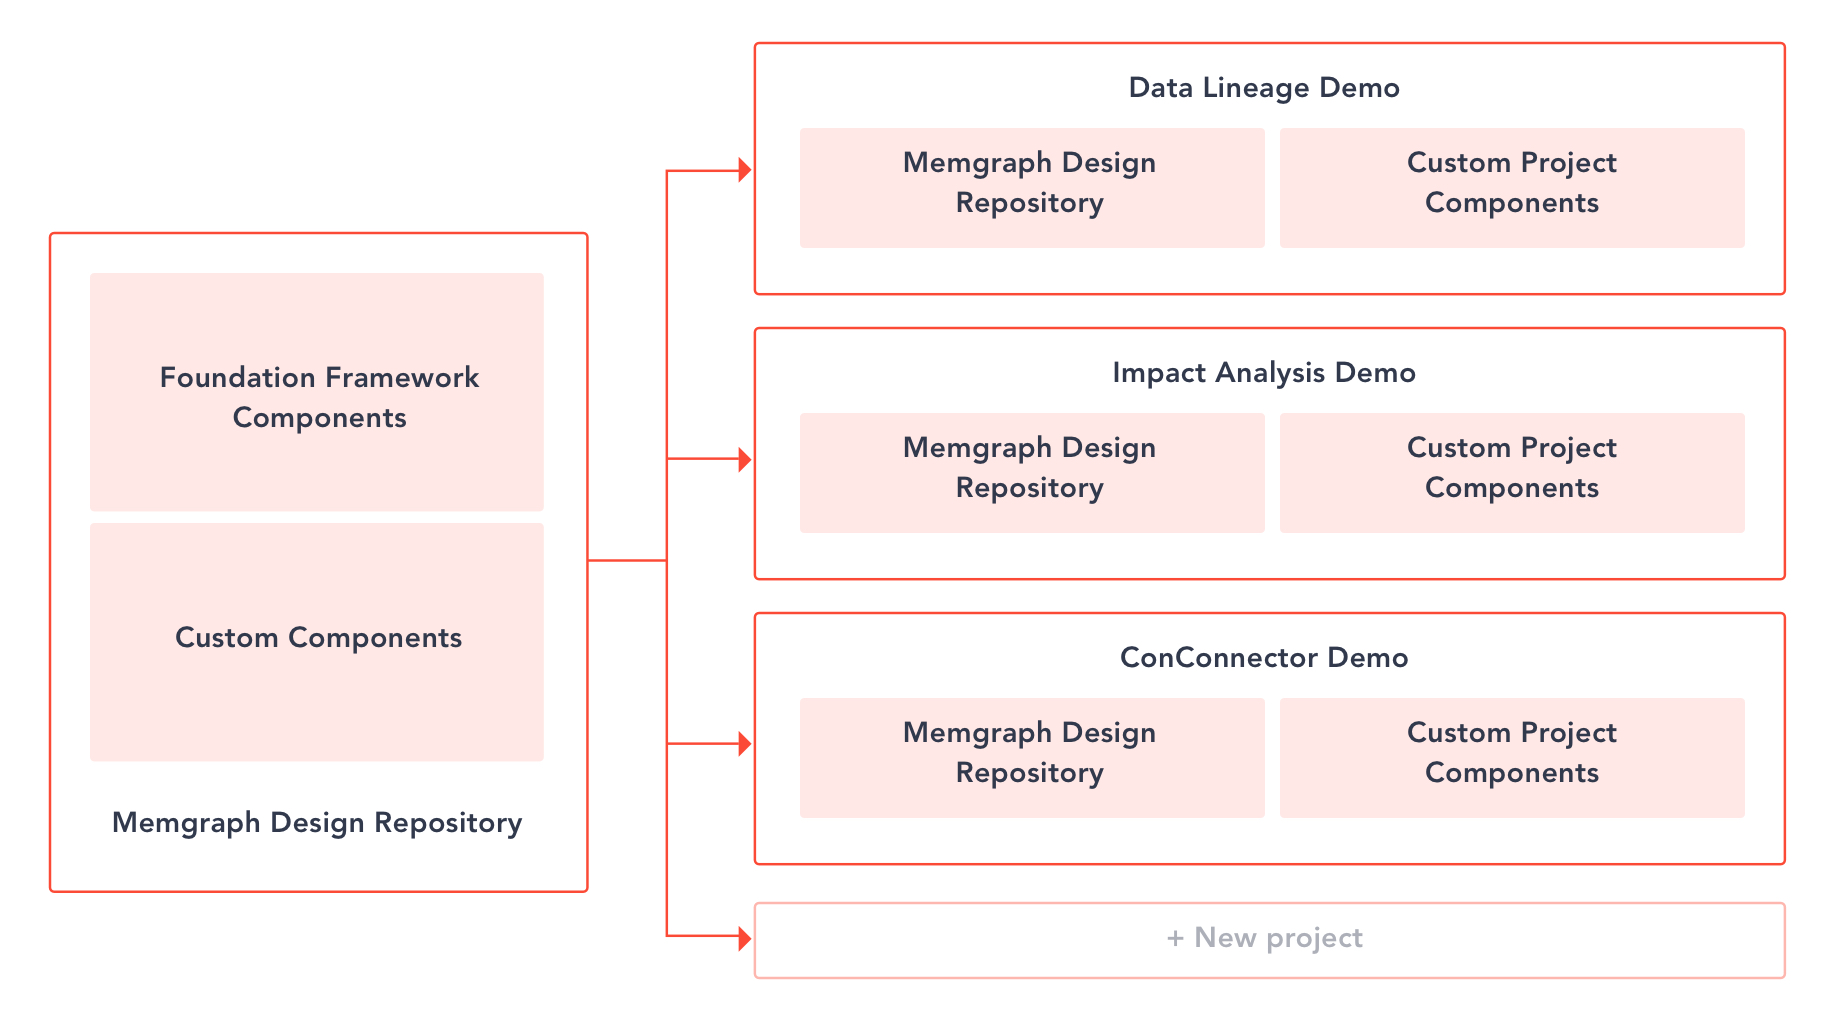
After initial wireframing iterations, I was able to create a modular design with components that could be easily extended for specific needs. The implementation of design components was based on Foundation framework and was served from one central repository into all of the demo applications for ease of use and maintenance.
The central design repository also consists of a simple dynamic style guide for easier implementation into future projects.
Design system modularity
Project outcomes
- Since the demo applications are internal tools and we don’t track the usual analytics on them, the benefits are measured quantitatively through a set of general business KPIs such as lead generation rate
- The ConConnector demo has proved to be a very successful tool for lead generation during the Strata Data Conference because of it’s real-time experience
- The “show, don’t tell” approach saved time and increased engagement when presenting Memgraph to prospective clients or investors
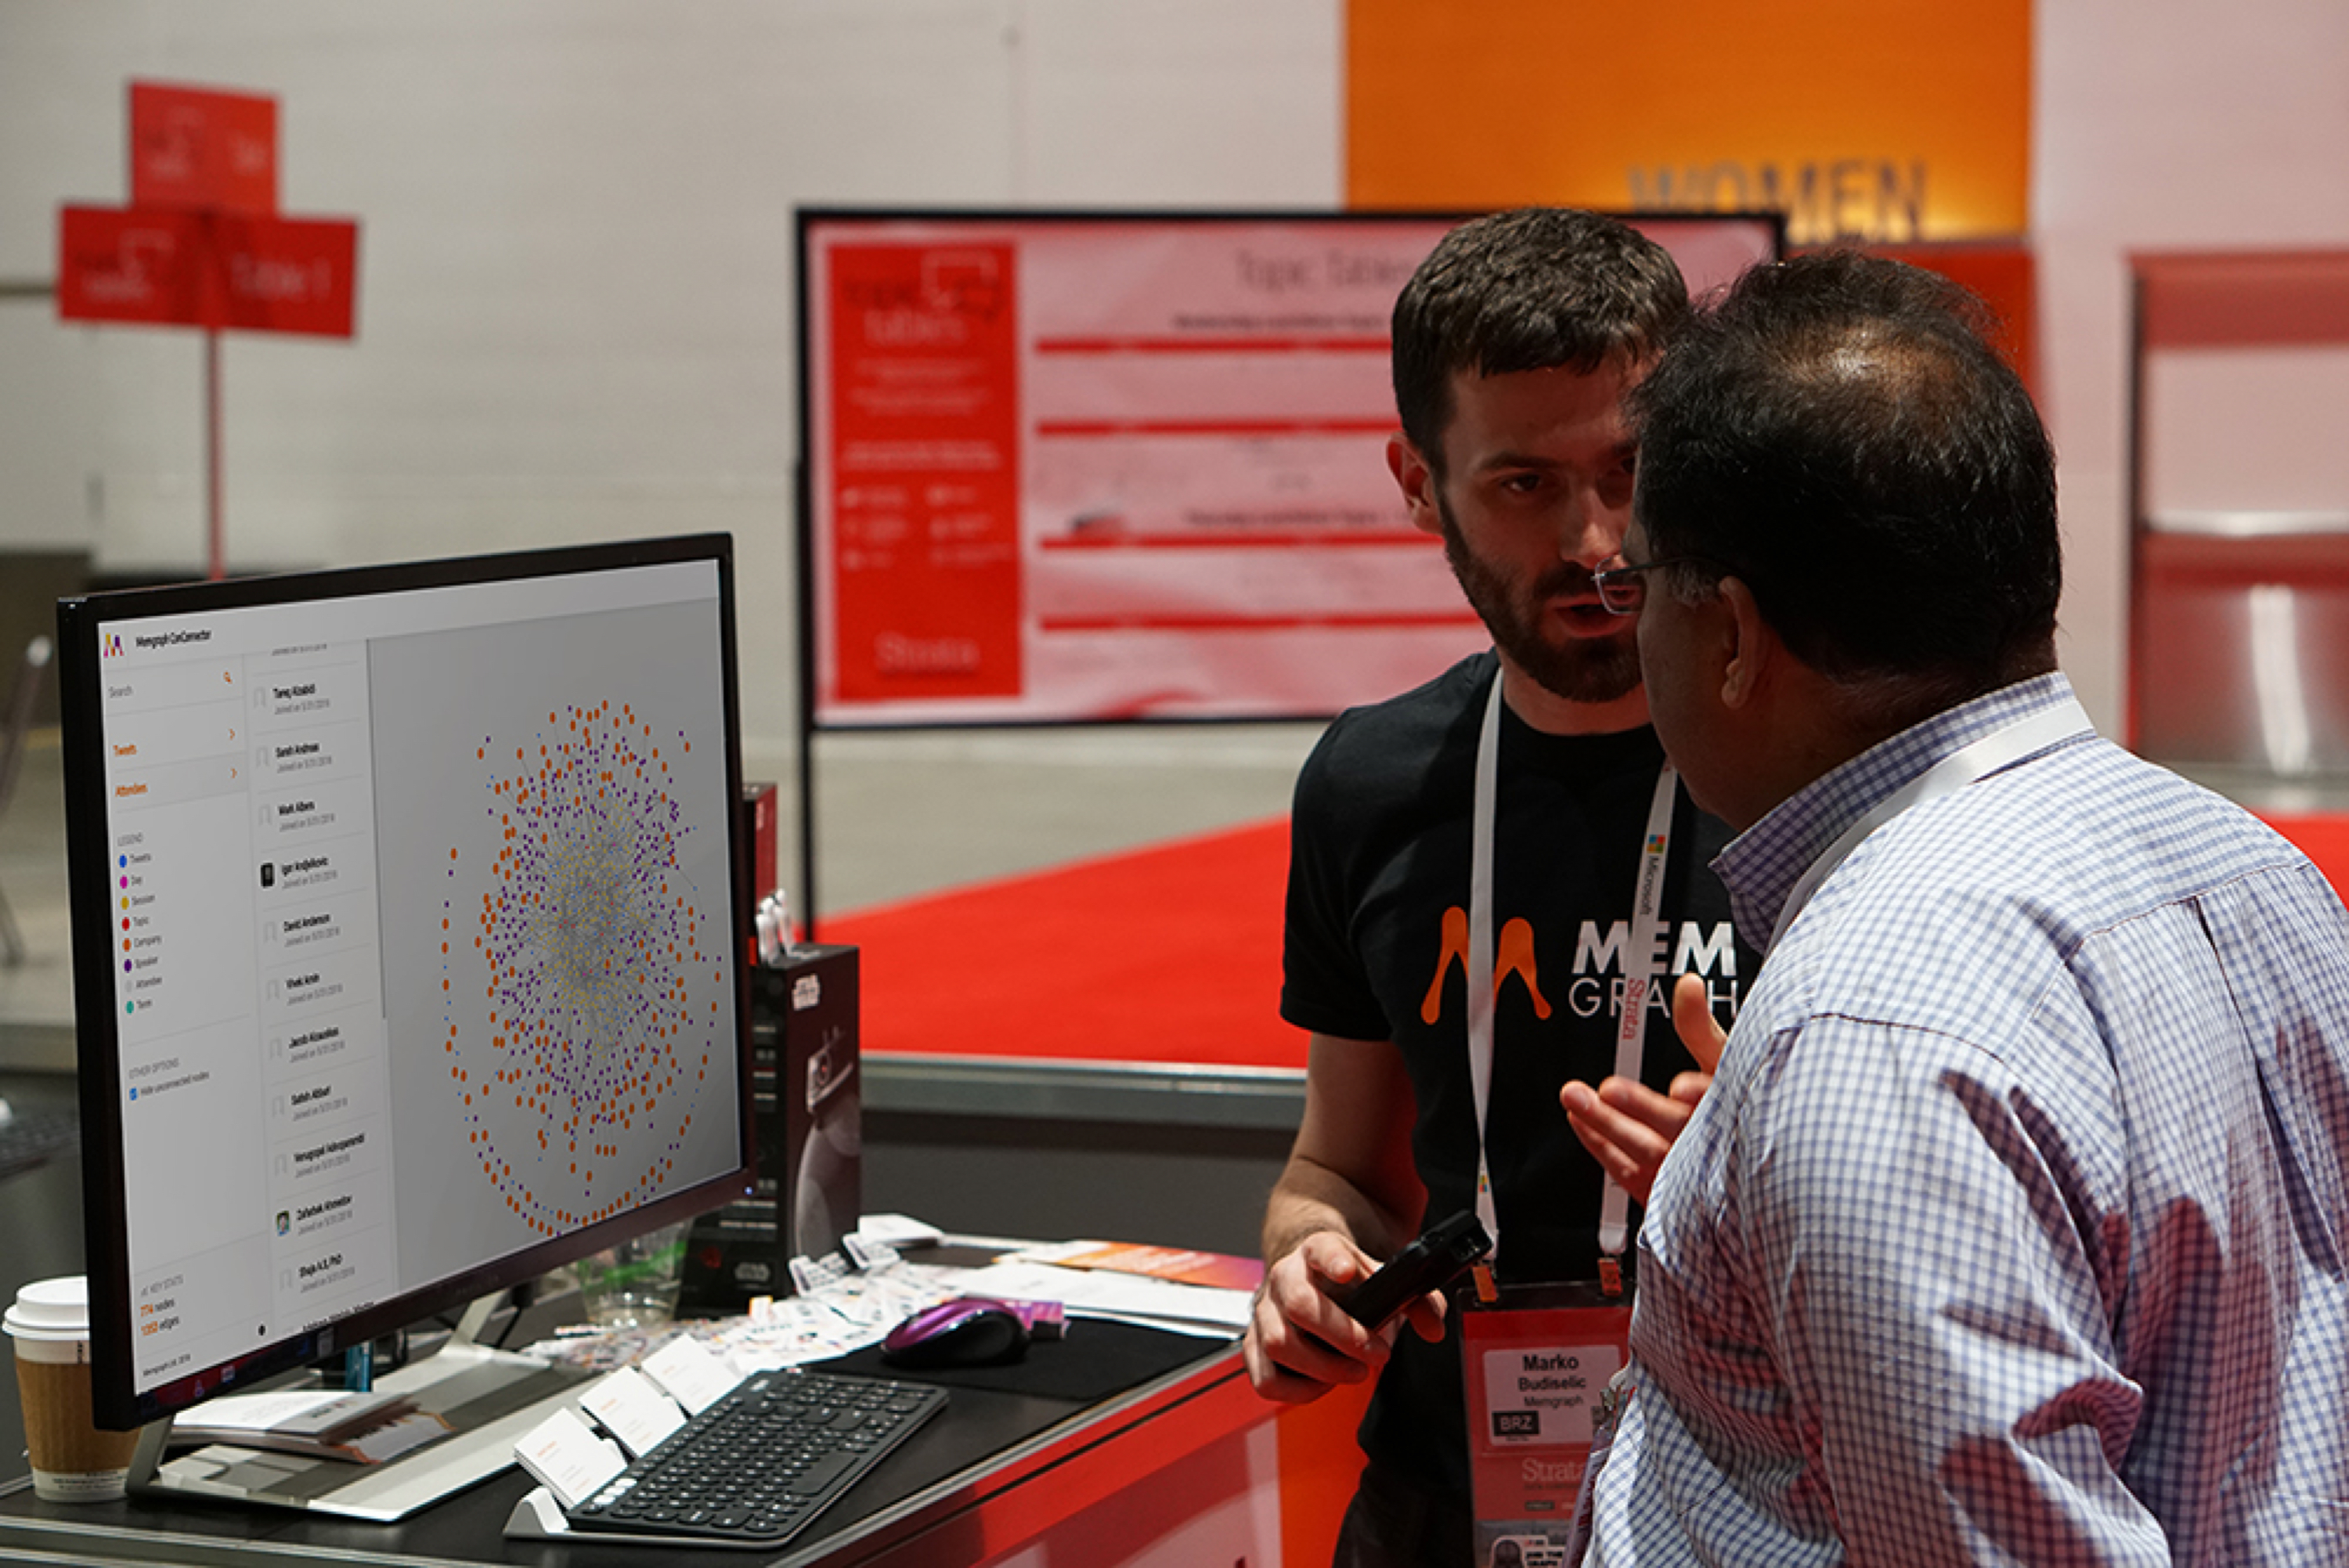 Conconnector in action by cofounder Marko
The Design System part in more detail
Introduction
Memgraph is the world’s first real-time distributed graph database, which aims to deliver high-performance at enterprise scale. It is engineered to support the needs of enterprises with colossal amounts of data. Memgraph aims to help businesses harness the power of real-time connected data, so they can build the next generation of intelligent applications.
Problem space
The product was expanding beyond purely CLI use and needed to create an application that provides a graphical user interface to manipulate graph database data.
Research
Research continued based on the initial one made for the same company, this time focusing more at gathering feedback from users (through surveys) that primarily manipulate database data.
Problems defined
- How to enable data scientists to get insights from the data?
- How to visualise complex graph database query results?
- What is needed to monitor and maintain the database?
- How to make running queries easier?
Goals
- Ensure obtaining a better market share by making the database product more usable
Target audience
- System administrator
- Database administrator
- Data analyst & Developer
Ideation and validation
In the first (beta) iteration of the project, we tried to focus on two activities for the users: monitoring and querying data at the same time. Another point of focus was exploration of the querying process where users should be enabled to perform consecutive database queries, save them and also search for them.
 Memgraph Lab Wireframes
Key findings
I tested our assumptions by setting up unmoderated usability studies based on the lo-fi prototypes that were created out of Sketch wireframes. Key findings that were discovered during the research:
- Different user roles want to use tools tailored to their needs
- Users need a seamless way to interconnect tools that they are using (management vs. querying)
- The space to run and manage queries needs to be distraction-free zone
Monitoring and querying of data proved to not work well for users because they wanted to focus on one action at the time, depending on their role (for example, a business analyst might not be interested to know what is the workload of the database). The overview of database queries with separate lists for query history and favorites proved to work better for users.
UI design
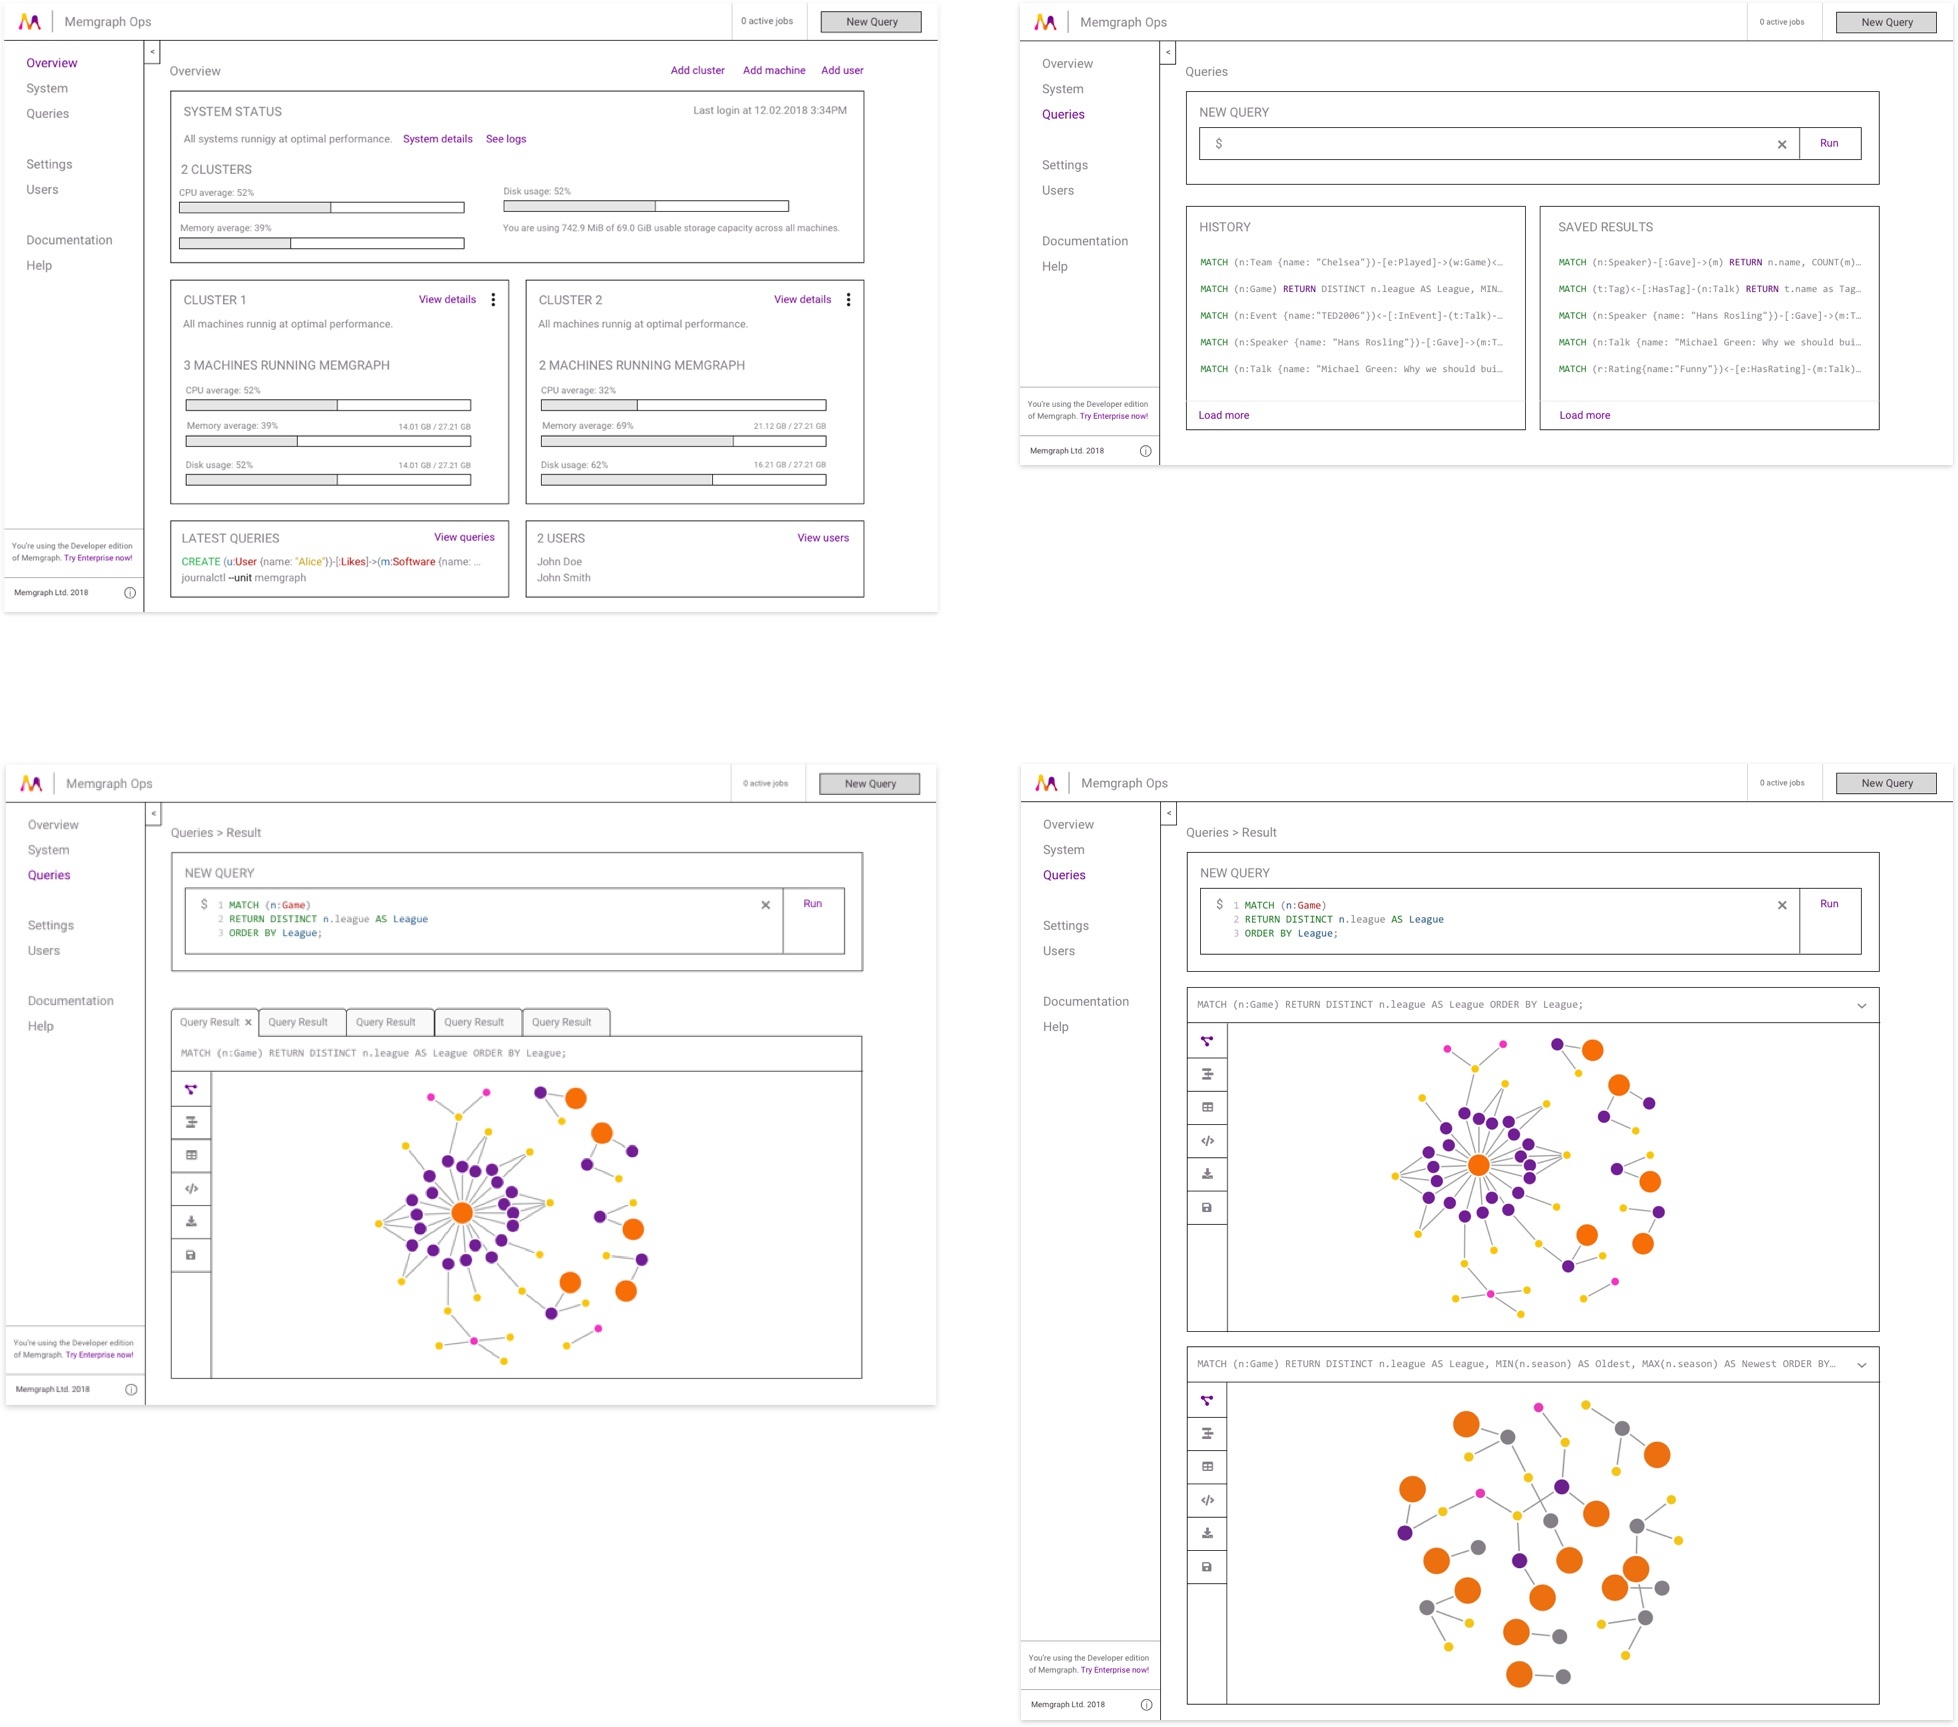
UI design of the application follows the previously established look and feel of the brand. In two iterations, there were adjustments to the statistics on the dashboard (based on user feedback) and top navigation was removed since this is a desktop application. Project frontend was developed by reusing existing components and styles.
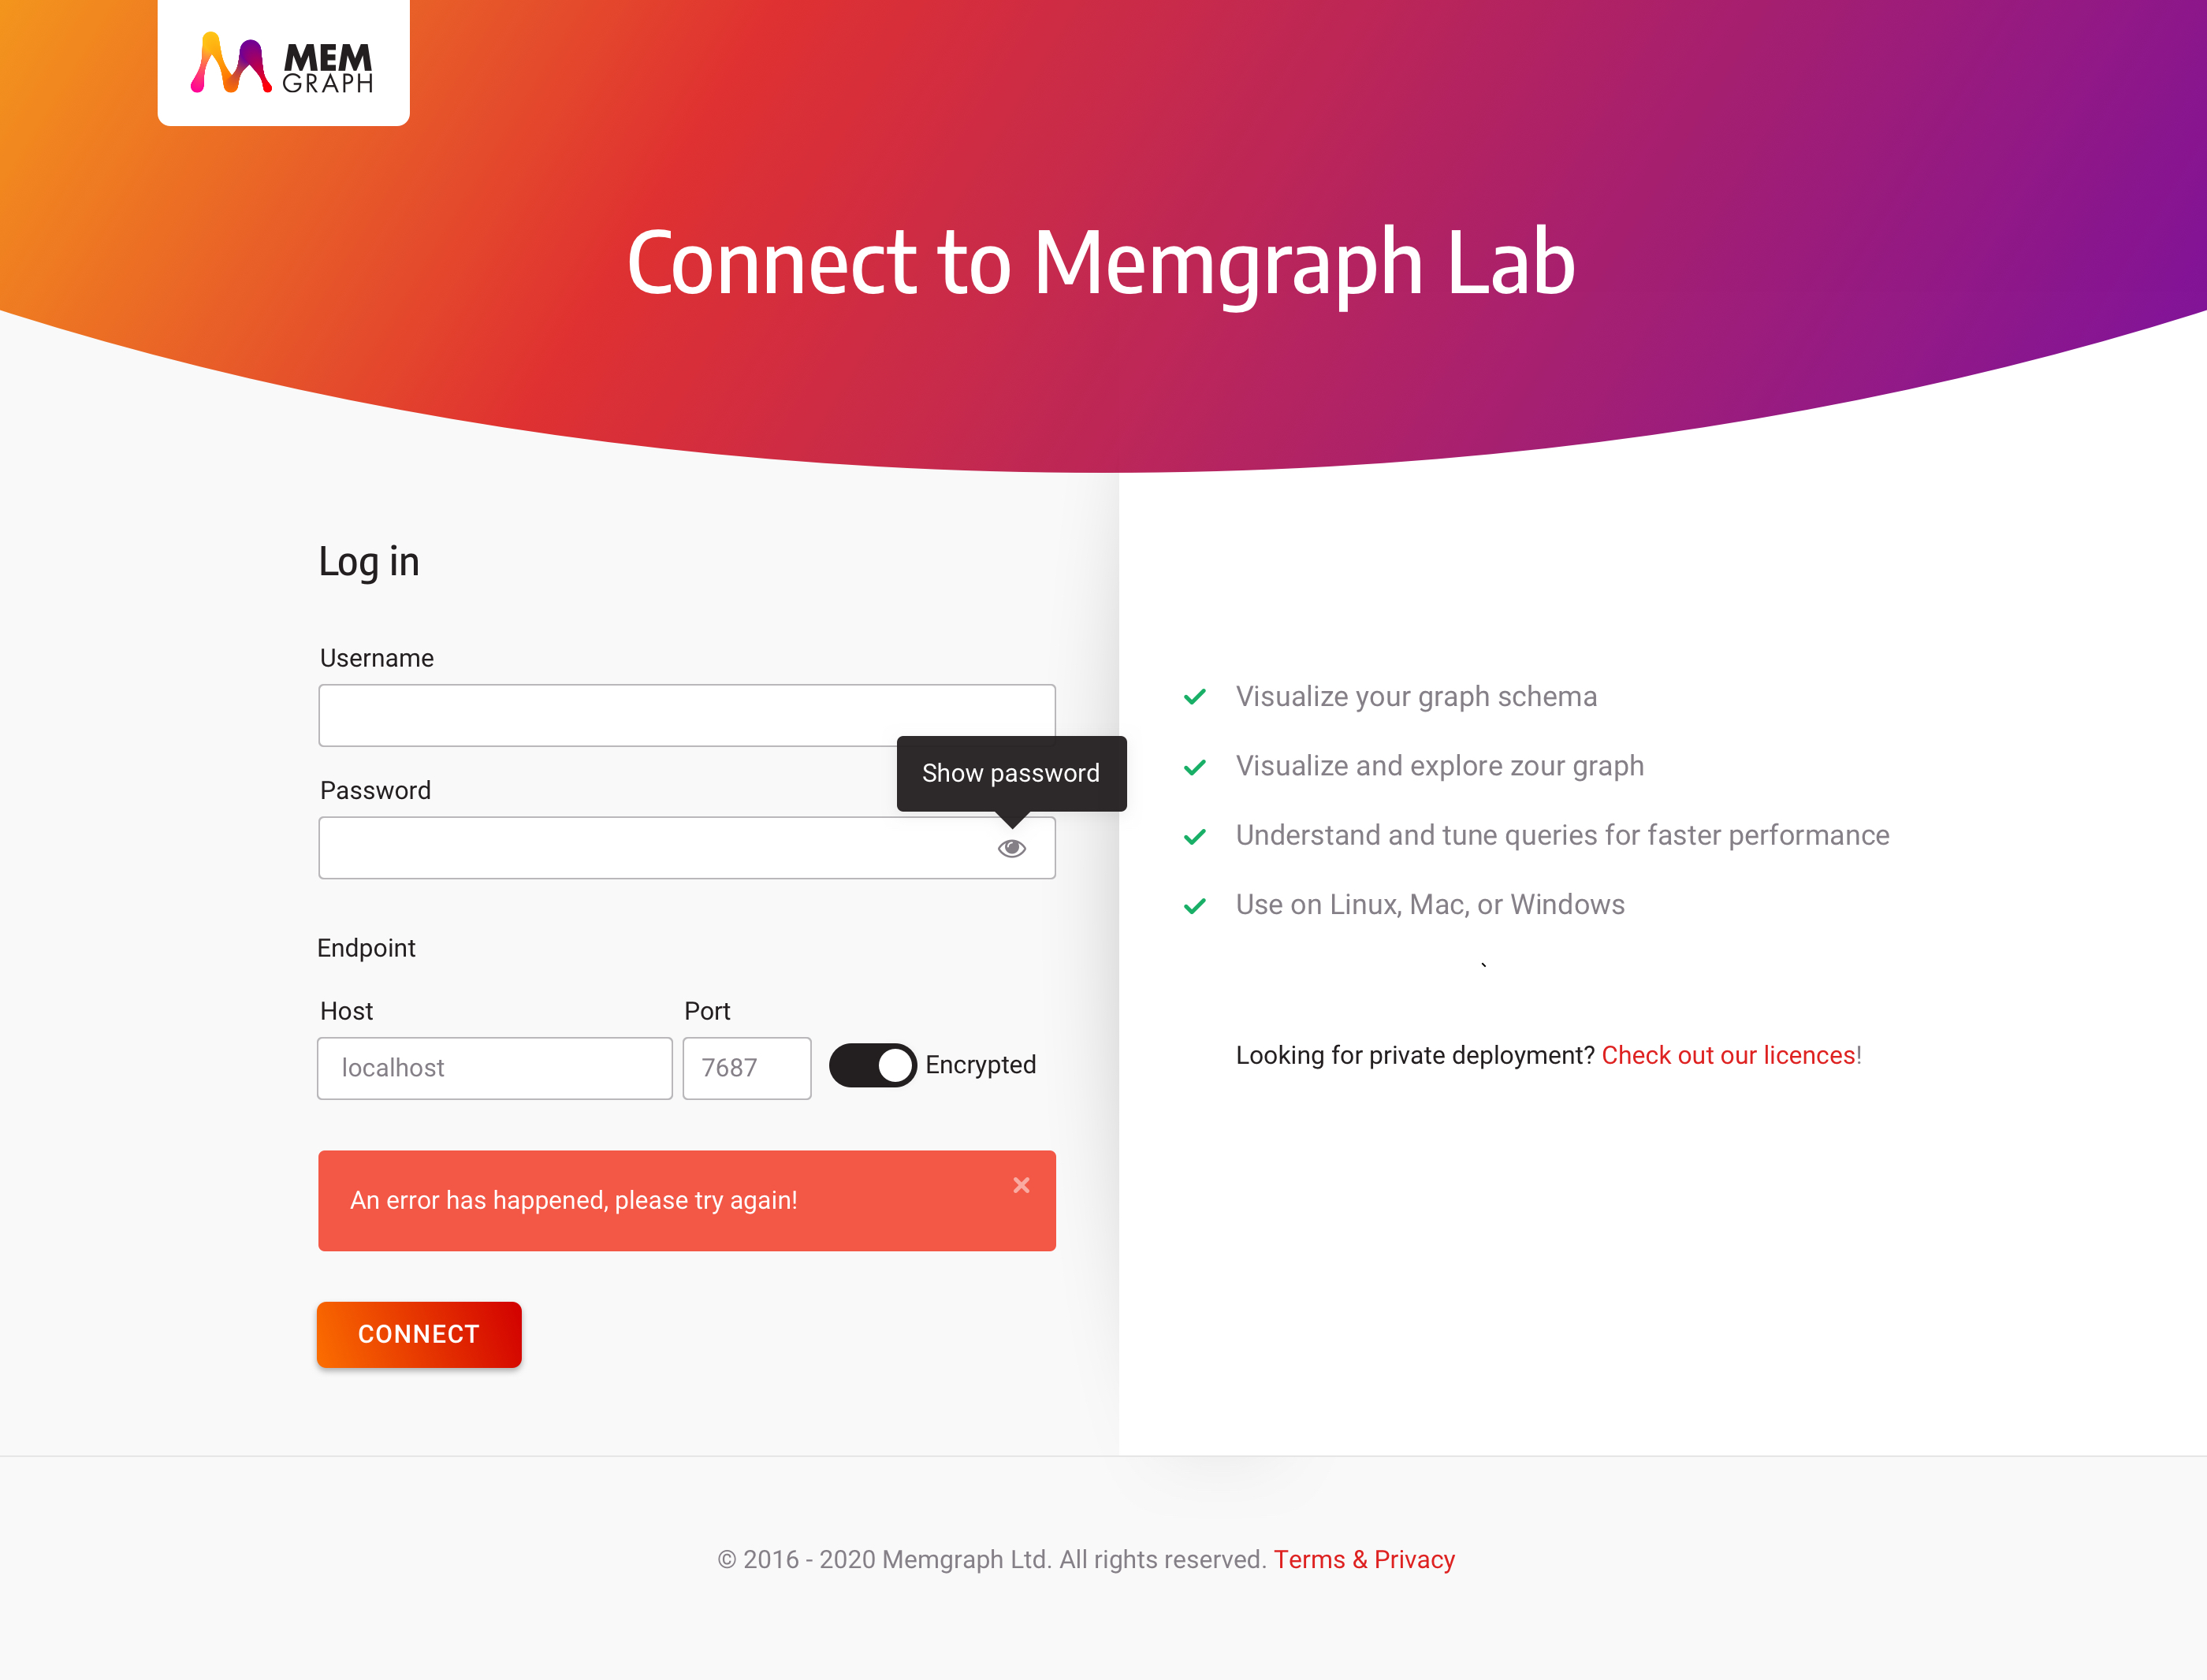
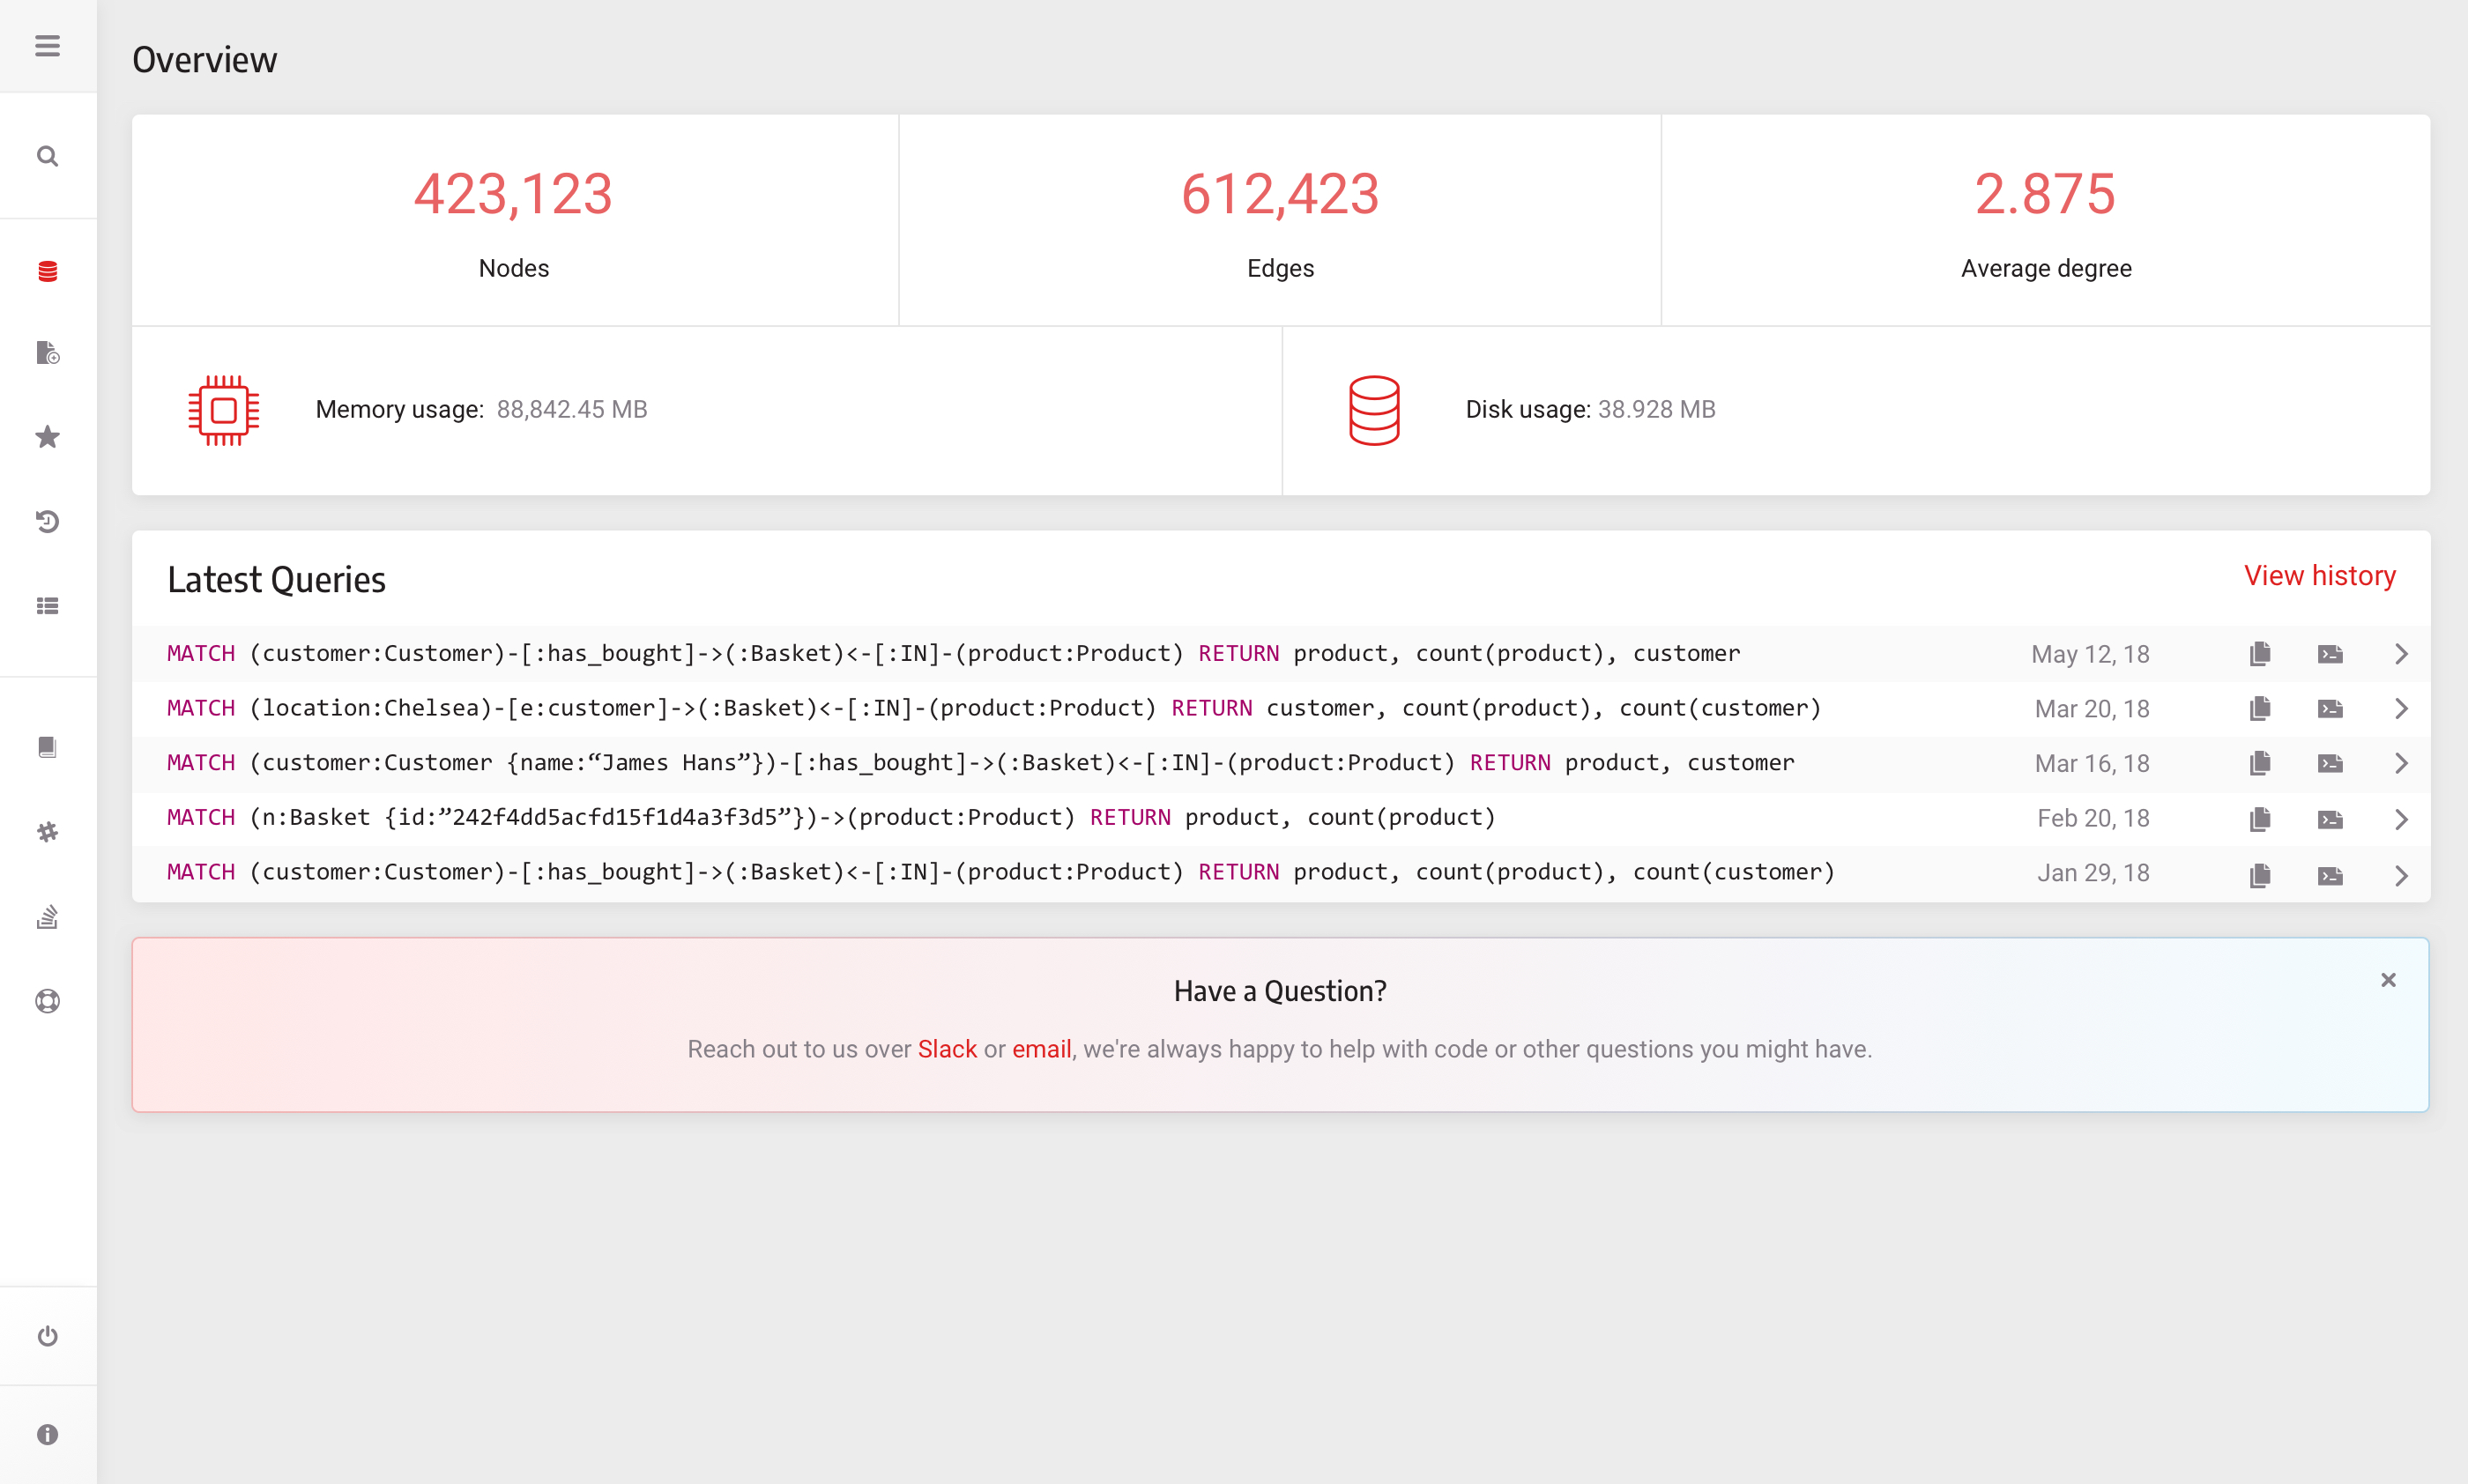
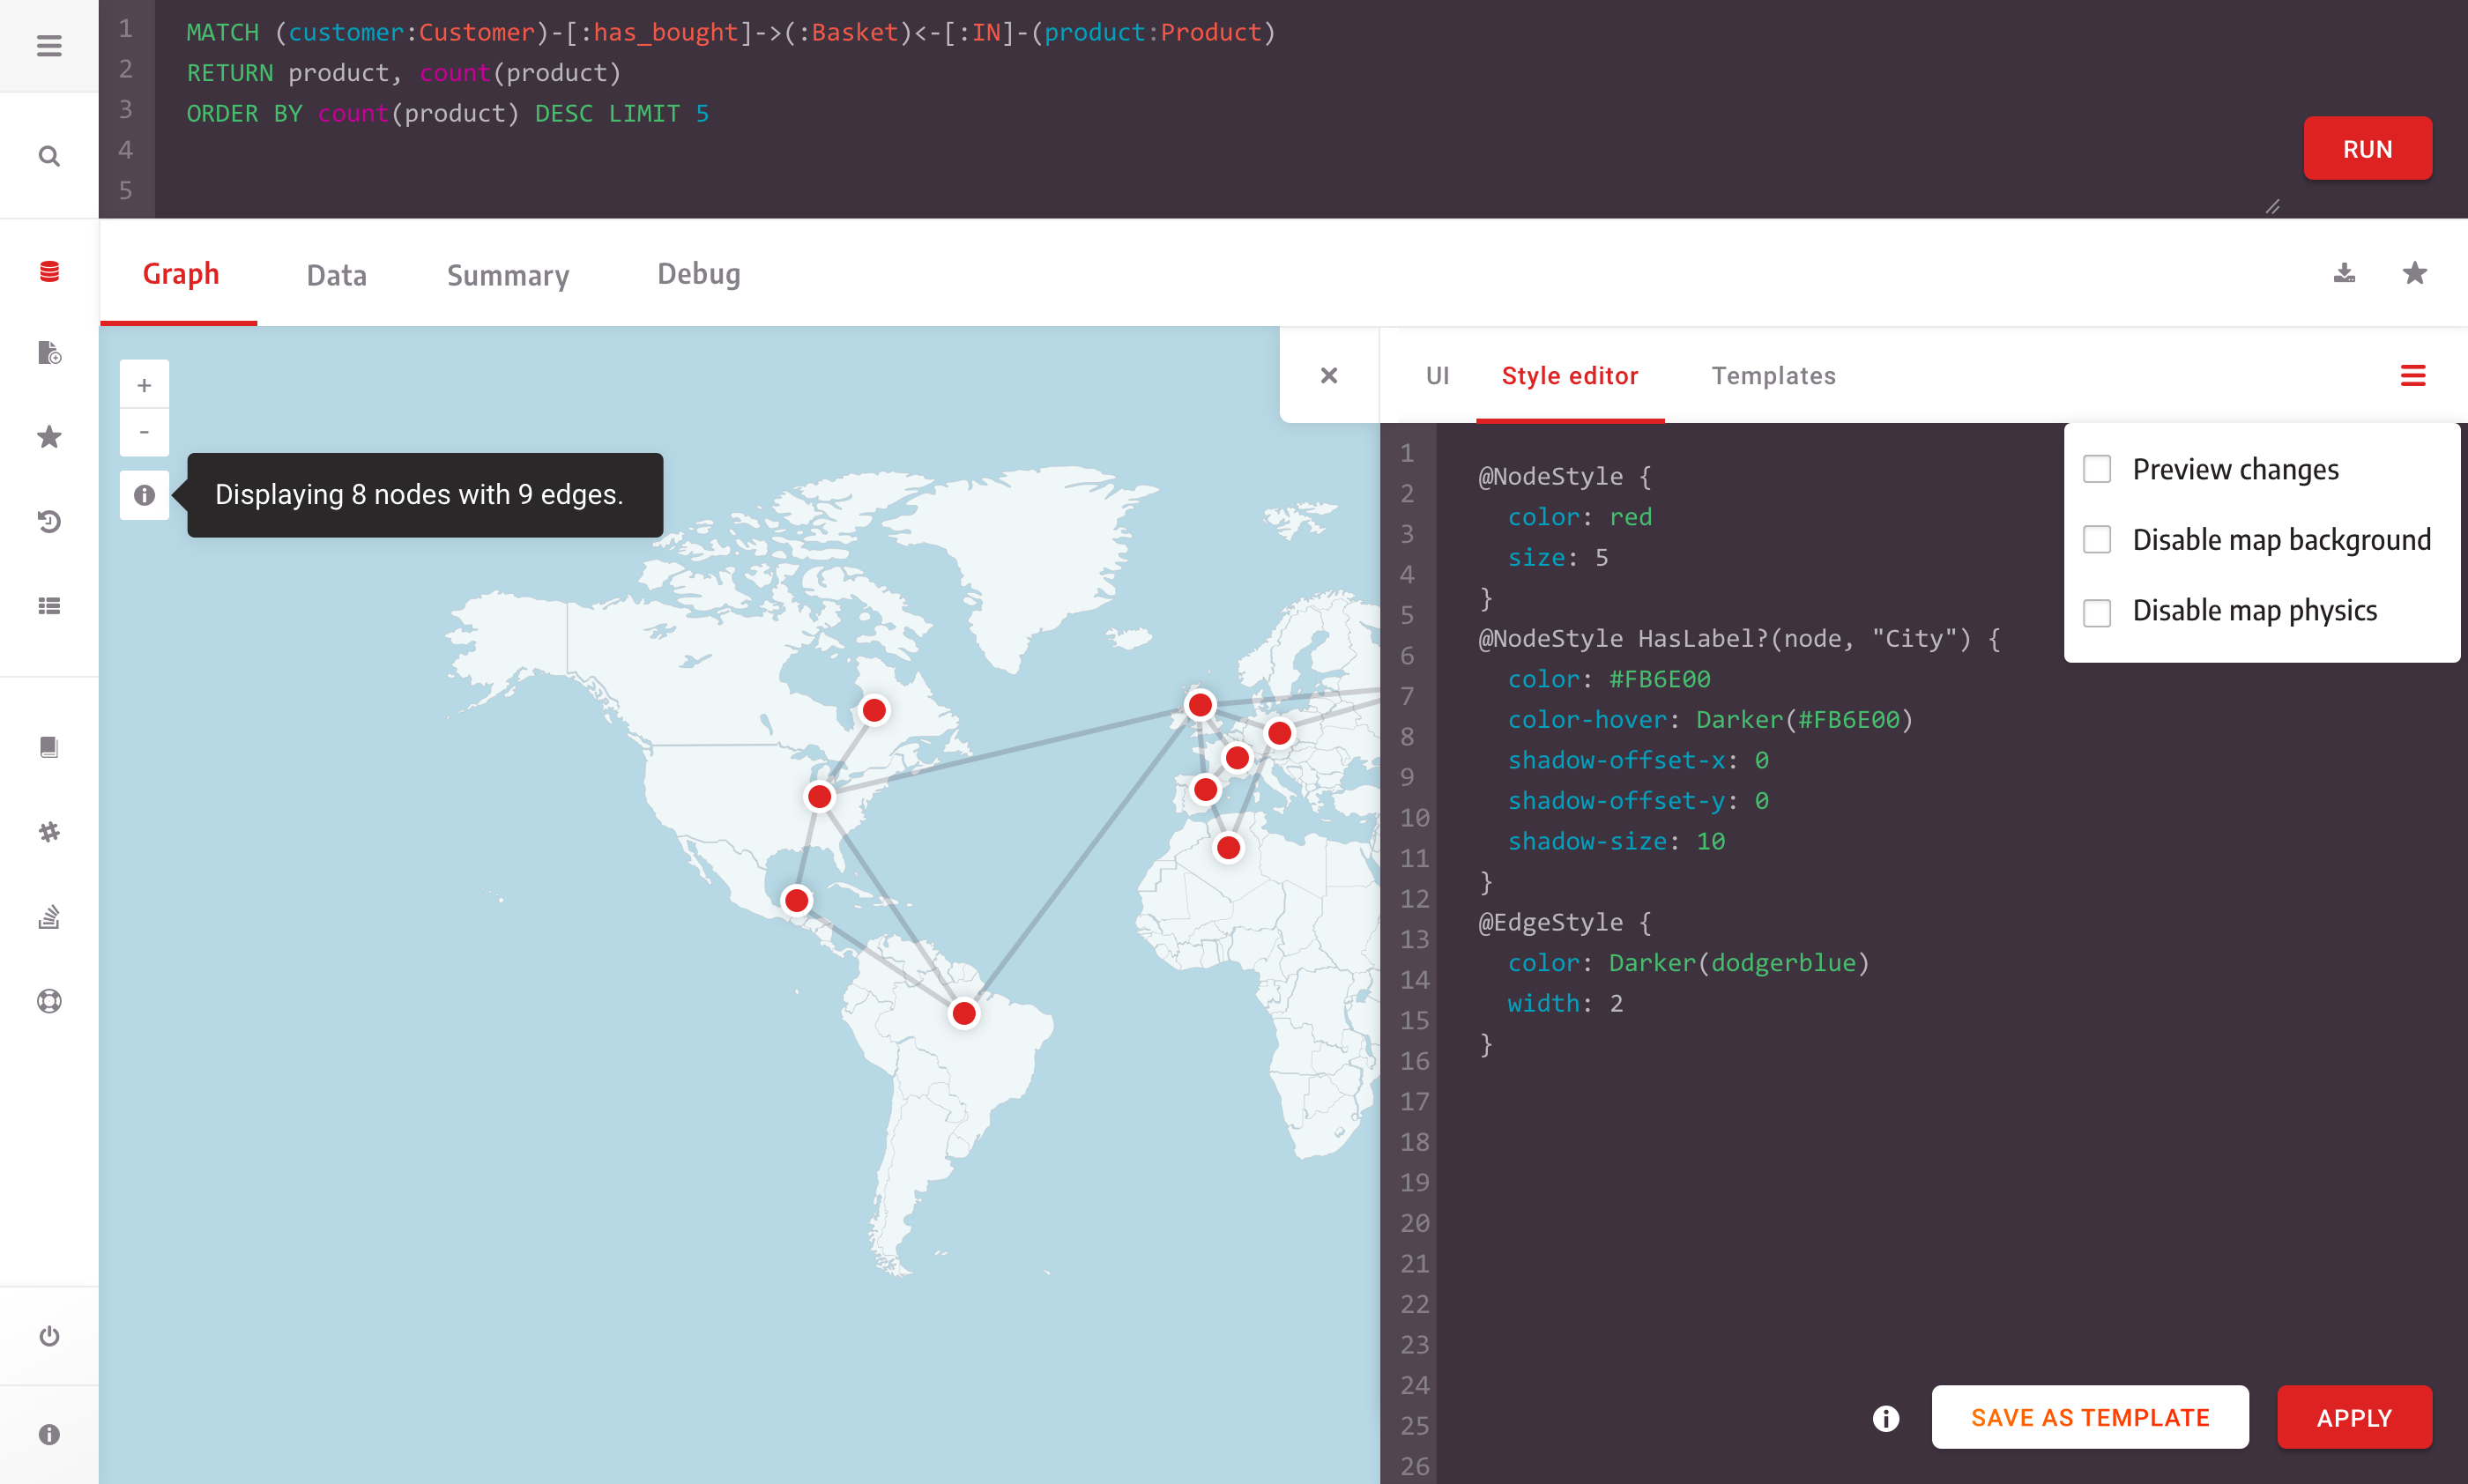
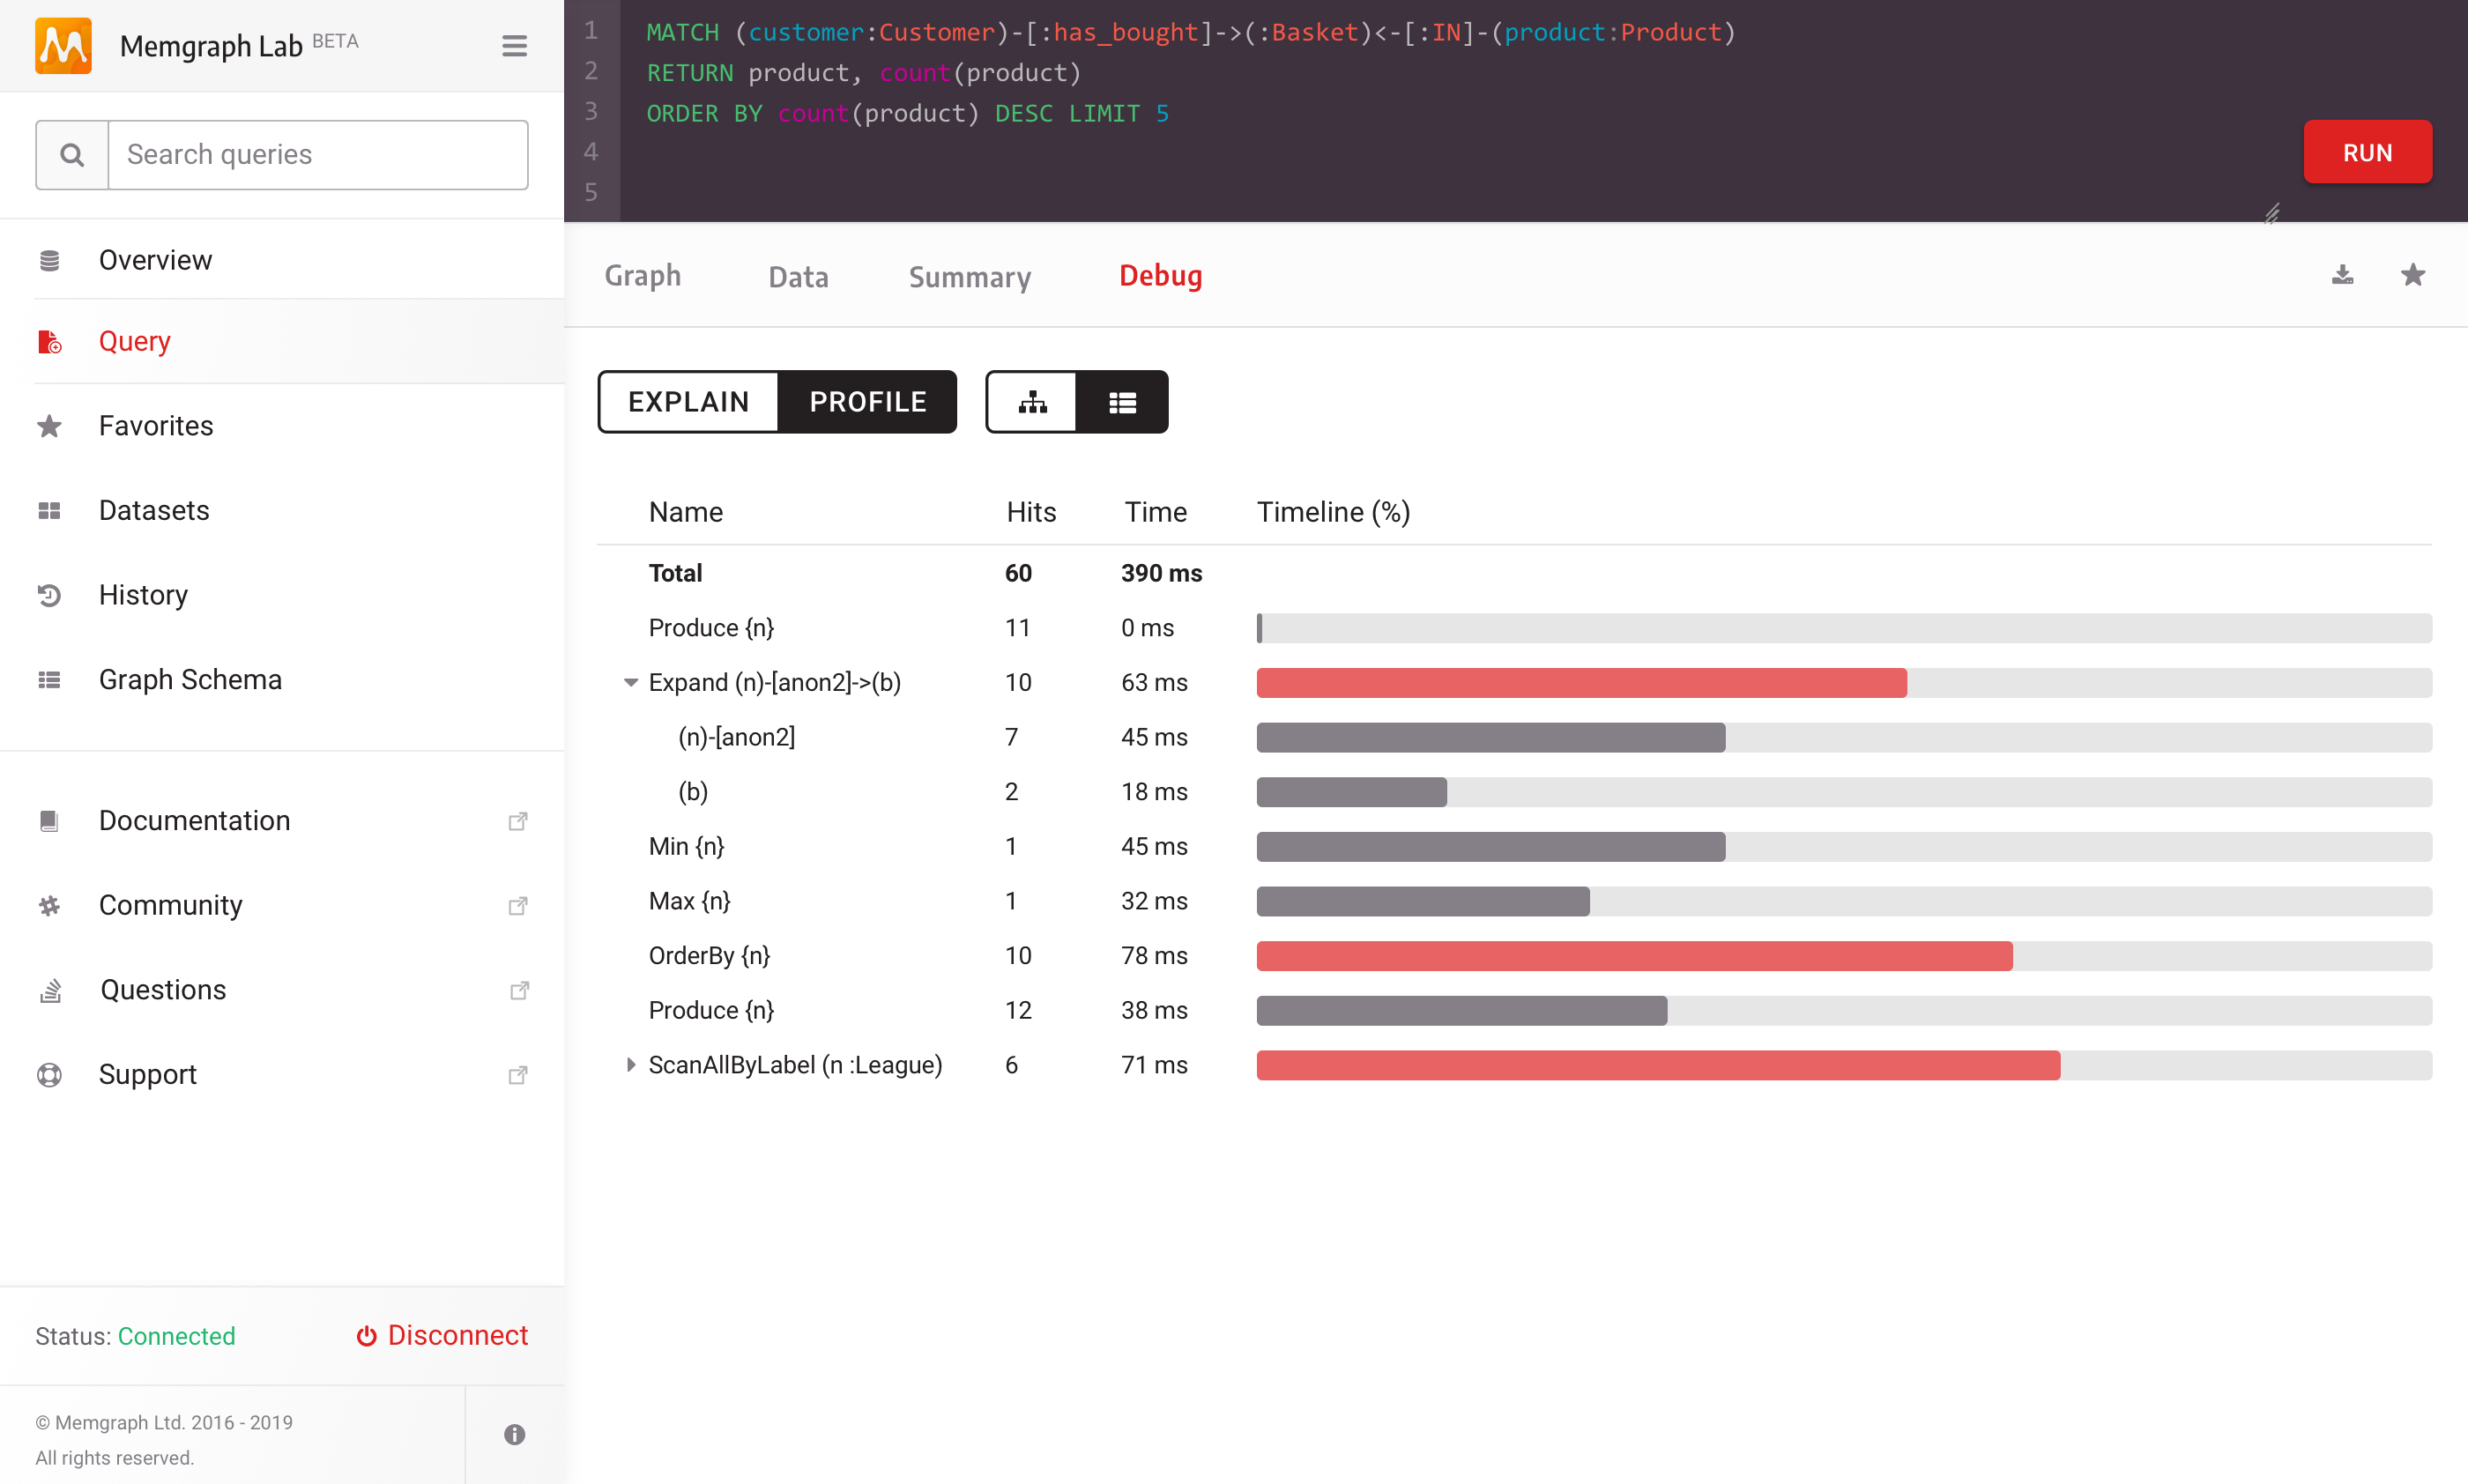 Memgraph Lab UI
Project outcomes
The project’s beta was published within the desired timeframe, and a newer version is freely available at memgraph.com.
Check out my other case studies:
- Increasing the test platform use with visual testing Sauce Labs
- Discovery for building an in-house use product dunnhumby Media
- Building a system to help the GTM motion of a graph database product Memgraph
Back to projects